 You-tube


Master Dimensions in D365 Business Central – A complete guide to designing, implementing, and maximizing Dimensions in D365 BC with expert support from Madhda Inc.
For any growing business, financial data is only as powerful as your ability to interpret it. Raw numbers alone do not tell the full story you need context. Which department spent the most last quarter? Which project is eroding your margins? Which region is underperforming? These are the questions that drive better management decisions.
1. What are dimensions in Business Central?
A Dimension in Business Central is essentially a metadata tag that you attach to financial transactions — sales orders, purchase invoices, general journal lines, and more. Each dimension has a code (such as DEPARTMENT or REGION) and a set of possible values (such as SALES, FINANCE, NORTH, or SOUTH).
When a transaction is posted, the dimension value travels with it and gets stored on the resulting GL entry. This means every financial record carries rich analytical context not just what was spent, but who spent it, for what purpose, and where.
The power of Dimensions is that they let you analyze your financials from multiple angles simultaneously, without needing to create separate accounts for every combination. Your chart of accounts stays clean and maintainable while your reporting becomes exponentially richer.
Without Dimensions vs. With Dimensions
Without: You need separate GL accounts like ‘Marketing Expense – North Region – Project Alpha’ and ‘Sales Expense – South Region – Project Beta’ — leading to hundreds of accounts, maintenance nightmares, and reporting chaos. With Dimensions: One ‘Marketing Expense’ account tagged with Department = Marketing, Region = North, Project = Alpha. Clean, simple, and infinitely flexible.
2. Understanding dimension types: global, shortcut, and additional
Business Central supports up to 8 dimensions, organized into three tiers based on frequency of use and how they are stored in the database.
Tier 1 — Global dimensions (dimensions 1 and 2)
These are your two most important dimensions — typically Department and Cost Center. They are stored directly on every GL entry and Customer/Vendor Ledger Entry table, making them the fastest to filter on and the most visible throughout the system. They appear as dedicated columns in list pages, reports, and account schedules.
Because changing global dimensions after go-live requires a background job to recalculate all ledger entries, it is critical to choose these thoughtfully before your implementation begins.
Tier 2 — Shortcut dimensions (dimensions 3–8)
These appear as shortcut entry fields directly on journal lines and document lines, making them easy to fill in without opening a separate dimension window. Common examples include Region, Project, Product Line, or Business Unit. They are slightly less fast to filter on than global dimensions but are highly versatile for secondary analytics.
Tier 3 — Additional dimensions
Any additional dimensions you define beyond the shortcut fields are accessible via the Dimensions action button on documents and journals. Best used for rarely needed analytical tags that still need to be captured for compliance or custom reporting purposes.
→ Choose carefully – changing after go-live requires data recalculation.
→ Great for Region, Project, Product Line.
→ Stored in Dimension Set Entry table.
3. The most common dimensions businesses use
- Department — Track costs and revenues by Sales, Marketing, Finance, HR, Operations. Enables internal P&L by department without separate company entities.
- Project / Job — Monitor income and expenditure at the project level. Know exactly which projects are profitable and which are over budget in real time.
- Region / Territory — Compare financial performance across geographic locations, sales territories, or warehouse branches without separate legal entities.
- Customer Segment — Group customers into Enterprise, SMB, Retail, etc. and analyze revenue, margins, and payment behavior by segment.
- Product / Service Line — Measure gross margin by product category or service type. Identify which lines drive profit and which are loss-making.
- Cost Center — A finer-grained version of Department useful when departments have multiple cost centers (e.g., IT split into Infrastructure, Development, and Support).
- Business Unit — Manage financials across divisions or subsidiaries without separate companies in Business Central.
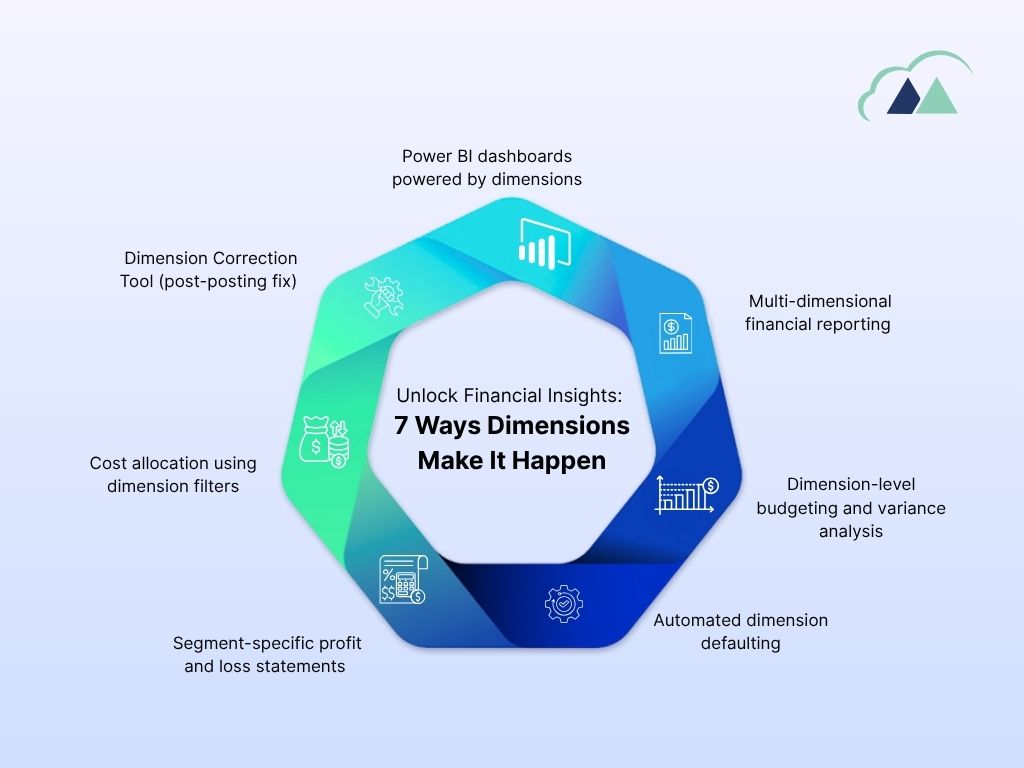
4. Seven ways dimensions optimize your financial data
| 1 | Multi-dimensional financial reporting Business Central’s Financial Reports (formerly Account Schedules) let you filter P&L statements, balance sheets, and cash flow reports by any combination of dimensions. Want Q3 marketing spend for North India on Product Line A? That is three filter clicks — no custom report development needed. Analysis Views pre-summarize GL entries by dimension groupings, enabling instant pivot-style analysis within the platform. |
| 2 | Dimension-level budgeting and variance analysis Business Central allows you to define budgets at the GL account and dimension level simultaneously. Set a budget for ‘Marketing – Advertising Expense – North Region’ and compare actuals in real time. Variance reports highlight exactly where spending is over or under budget — with drill-down to individual posted transactions. Your annual budget becomes a live management control tool, not a static spreadsheet. |
| 3 | Automated dimension defaulting Set default dimensions on Customers, Vendors, Items, GL Accounts, and Employees. When a transaction involves these master records, Business Central automatically populates dimension values. Dimension value posting rules (Mandatory, Fixed, Same Code, No Code) enforce compliance. For example, marking a dimension as Mandatory on certain accounts ensures no one can post without providing the required context. |
| 4 | Segment-specific profit and loss statements Generate a separate P&L for each business segment without creating separate legal entities. A multi-brand retail company can tag every transaction with a Brand dimension and produce individual income statements for each brand — all from the same dataset. Ideal for board reporting, investor presentations, and management discussions where segment profitability is critical. |
| 5 | Cost allocation using dimension filters Shared costs — rent, utilities, IT infrastructure, HR — are difficult to allocate fairly. Dimensions make this structured and auditable. Using the Allocations feature with dimension filters, define allocation rules and have Business Central automatically generate the allocation journal entries. Every allocation is traceable back to its source. |
| 6 | Dimension Correction Tool (post-posting fix) A major improvement in recent Business Central versions: the Dimension Correction Tool allows finance teams to fix incorrect dimension values on posted GL entries without reversing and reposting the transaction. This is a game changer for month-end close processes. The correction is logged, auditable, and updates all downstream analysis views automatically. |
| 7 | Power BI dashboards powered by dimensions Business Central’s native Power BI integration exposes all dimension data through its API and data connector. Finance teams and executives can build interactive dashboards with slicers that filter by any dimension. No data warehouse, no ETL pipeline, and no manual exports required. |
5. Dimension value hierarchies and totaling
Business Central supports dimension value types — Standard, Heading, Total, Begin-Total, and End-Total — similar to how GL accounts are structured. This means you can create hierarchies within a dimension.
For example, your Region dimension might have India as a Heading, North India, South India, West India, and East India as Standard values, and India Total as a Total that sums all four. This lets your financial reports show subtotals and totals by dimension grouping — exactly like a structured chart of accounts, but for your analytical dimensions.
Example dimension hierarchy — Region
INDIA [Heading] NORTH-IN [Standard] SOUTH-IN [Standard] WEST-IN [Standard] EAST-IN [Standard] INDIA-TOTAL [Total: NORTH-IN..EAST-IN] GLOBAL [Heading] USA [Standard] UK [Standard] GLOBAL-TOTAL [Total: USA..UK]
6. Common mistakes to avoid with dimensions
| 1 | Changing global dimensions after go-live without planning. This triggers a background recalculation across all ledger entries and can be disruptive if not scheduled during off-peak hours. |
| 2 | Creating too many dimension values with inconsistent naming (e.g., ‘Mktg’, ‘MARKETING’, ‘Marketing Dept’) — leading to fragmented data and unreliable reports. |
| 3 | Not setting mandatory dimensions on critical accounts, leading to some transactions being posted without dimension tags – creating gaps in your analytical data. |
| 4 | Over-complicating the dimension structure upfront by defining 8 dimensions before understanding actual reporting needs – leading to user confusion and inconsistent tagging. |
| 5 | Skipping user training — Dimensions are only as accurate as what users enter. Without clear guidance and enforced rules, dimension data becomes unreliable within weeks of go-live. |
How Madhda helps you optimize D365 BC using dimensions
Knowing what Dimensions can do and actually implementing them well in your business are two very different things. The right dimension structure depends on your industry, organizational model, reporting requirements, and how your teams work day-to-day. This is where Madhda Inc brings real value.
As a certified Dynamics 365 Business Central partner, Madhda has helped businesses across industries design, implement, and optimize their dimension frameworks turning raw financial data into decision-ready intelligence.
Service 1 — Dimension needs assessment and design workshop
Madhda begins every engagement with a structured discovery workshop involving your finance leadership, department heads, and operations teams. The goal is to map your actual reporting questions What does the CFO need to see monthly? How does the board want performance segmented? — to the right dimension structure. This prevents the common mistake of over-engineering dimensions that no one uses, or under-engineering and having to restructure after go-live.
Service 2 — Global dimension selection and migration support
Choosing global dimensions incorrectly is one of the most expensive mistakes in a Business Central implementation. Madhda’s consultants guide you through the selection process, ensure your choices align with your long-term reporting strategy, and if migrating from a previous system — manage the data migration so that historical transactions are tagged with the correct dimension values from day one. No data gaps, no compromise on historical reporting.
Service 3 — Default dimension configuration across master data
Madhda configures default dimensions and posting rules across all relevant master data — customers, vendors, items, GL accounts, and employee records. This includes setting up Mandatory, Fixed, and Same Code rules where appropriate so dimension tagging is enforced at the system level. The result: clean, consistent dimension data from the very first transaction, not three months in when someone realizes the data is incomplete.
Service 4 — Custom financial reports and analysis views
Madhda builds the Financial Reports and Analysis Views your management team actually needs department P&Ls, project profitability summaries, region-wise revenue breakdowns, and budget vs. actual dashboards. These are configured directly within Business Central, requiring no third-party tools. Reports are built to match your existing management reporting templates so your finance team gains speed and automation without relearning format.
Service 5 — Power BI dashboard development with dimension slicers
Madhda connects your Business Central dimension data to Power BI and builds executive-ready dashboards tailored to your KPIs. Finance dashboards show P&L by department, cash flow by region, and outstanding payables by vendor category all interactive and real-time. These dashboards are designed for non-technical users such as CEOs, board members, and department heads who need answers instantly without opening Business Central itself.
Service 6 — Dimension audit, cleanup, and optimization for existing users
Already using Business Central but finding dimension data messy, incomplete, or not helping your reporting? Madhda offers a Dimension Health Audit a structured review of your current dimension setup, posting rules, user adoption, and reporting utilization. The outcome is a prioritized action plan: what to fix, what to consolidate, and what to add. Madhda then executes the cleanup using the Dimension Correction tool, minimizing disruption to live operations.
Service 7 — User training and adoption programs
Madhda delivers role-specific training for every user who touches Business Central from accounts payable clerks who tag purchase invoices to finance managers who run dimension-filtered reports. Training is practical and scenario-based, using your actual data and dimension structure. Madhda also provides a Dimension User Guide tailored to your business, ensuring new joiners are onboarded consistently.
Why businesses choose Madhda for Business Central Dimensions
Deep BC expertise Certified consultants with hands-on experience across Finance, Manufacturing, Retail, and Services. Business-first approach We start with your reporting questions, not the technology, designing dimensions that answer what leadership actually asks. End-to-end delivery From design through configuration, reporting, Power BI, and training one partner, one consistent team. Post go-live support — Ongoing support to refine your dimension structure as your business grows and reporting needs evolve.
Conclusion
Microsoft Dynamics 365 Business Central’s Dimensions feature is not just a reporting convenience — it is a fundamental financial architecture decision that shapes how well your business can analyze performance, control costs, and make data-driven decisions at every level of the organization.
When designed correctly, Dimensions give you the analytical power of a complex multi-entity setup with the simplicity of a single, unified system. When designed poorly, they create noise, confusion, and reports that no one trusts.
Madhda Inc exists to make sure your Business Central dimension implementation falls firmly in the first category turning your financial data from a record-keeping obligation into a genuine competitive advantage.
Ready to Unlock the Full Power of Business Central Dimensions? Talk to a Madhda consultant today.
🌐 Website: www.madhda.com 📧 Email: sales@madhda.com