 You-tube


Introduction:
Microsoft has enhanced the AL performance profiler (available starting from version 19 only via Visual Studio Code) giving the possibility also to functional developers/consultants, as well as customer administrators and power users to capture a user flow from within the web client and view high-level information about time spent in the web client itself.
The new in-client performance profiler is a new page that can be opened independently or directly from the Help & Support page and permits you to investigate user flows performances without using Visual Studio Code tools.

How does it work:
To start using the in-client performance profiler, you can select the Help & Support menu and click on the Analyze performance link:

or you can select the Performance Profiler page via search:

As the profiler page said, you can use the performance profiler to record a slow scenario that you can then analyse to see what took a long time. Please note that the profiler uses sampling technology, so the results may differ slightly between recordings of the same scenario.
To start monitoring, I suggest to open the profiler page in a new browser window (more user friendly for me, but that’s up to you).
For this scenario, let’s imagine that I’ve developed an extension (here called InClientProfilerDemo) that creates a performance problem on the Sales Invoice page. To simulate this, I’ve simply created an extension with a codeunit and the following event subscriber:

With the two windows opened (Sales Invoice list and Performance Profiler page), now let’s start the Performance Profiler (by clicking the Start button) and, when started, let’s execute your process to monitor (in my case, opening the Sales Invoice card and doing some actions):

Here I’ve opened an existing sales invoice, added a new line and then closed the document.
When the flow is completed, go back to the Performance Profiler page and click Stop. These are the results that appears to you:

In the Active Apps pane, the profiler shows the apps involved on the process and the time that you can save by removing each app (as you can see, the InClientPerfProfilerDemo app if removed can save you 2000 milliseconds).
You can also aggregating apps by Publisher and by App Name by selecting Actions and then the Aggregate By action:

You can also click on the Show technical information toggle in order to discover more things. The Time Spent pane shows you which apps were running during the recording of the process and the length of the activity per app (time spent calling other apps is not included):

By clicking on my app, I can discover that it takes 1971 milliseconds to execute.
If you click on Time Spent by Application Object, you can discover the time spent on each object involved in the monitored process, ordered by Time Spent descending. Here we can discover that the codeunit called SDSlowProcess is what takes a lot of time:

Then in the Call Tree pane we can analyse the entire stack of calls for the monitored process:

Here we can discover that our slow process starts after the opening of the page. Nice, isn’t it?
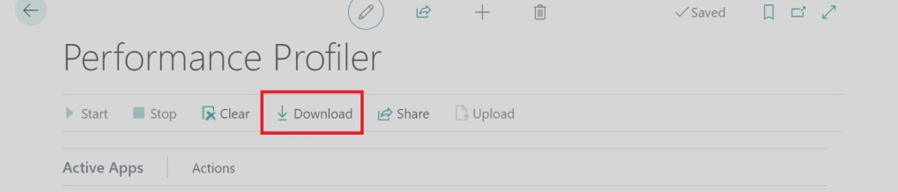
Your recorder profiler data can also be exported by clicking on the Download button:

This will permit you to download a .alcpuprofile file that you can open from Visual Studio Code for more analysis:

The profile file can also be shared to Onedrive by using the Share button.
Thank you for investing your time to read our blog! We’re passionate about sharing valuable insights to help you navigate the world of Business Central.
If you’re curious about how we can assist you in reaching your goals, don’t hesitate to get in touch. Our dedicated team is ready to provide support every step of the way.
Let’s turn your vision into reality together!