Upgrading to API v2.0: Enhancing Performance and Capabilities
Transitioning from API v1.0 to API v2.0 brings enhanced security, improved performance, new features, and comprehensive support, ensuring a seamless upgrade for modern applications.
 API
API
Transitioning from API v1.0 to API v2.0 brings enhanced security, improved performance, new features, and comprehensive support, ensuring a seamless upgrade for modern applications.

As large businesses expand, transitioning from Xero to more robust financial systems becomes essential. Upgrading ensures scalability, enhanced functionality, and better integration, enabling smoother operations and supporting long-term growth and compliance needs.
 Microsoft Dynamics Business central
Microsoft Dynamics 365 Business Central (BC) is a comprehensive business management solution that helps organizations streamline their processes and improve overall efficiency. One of the powerful features of Business Central is the ability to customize dimensions, which are attributes you assign to entries for tracking and analyzing purposes. This blog will guide you through the […]
 Microsoft Dynamics Business central
IsolatedStorage data type is used to store data in an isolated manner in Business Central. Isolated Storage is key-value-based storage that provides data isolation between extensions.
 Electronic Data Interchange(EDI)
Discover how Electronic Data Interchange (EDI) enhances efficiency, accuracy, and growth in business operations by automating data exchanges.
 Microsoft Dynamics Business central
Dimension Correction in Business Central allows users to adjust dimensions on posted entries without reversing and reposting transactions.
 Dynamics 365 Sales, Microsoft Dynamics Business central
Connecting Dynamics 365 Business Central with Dataverse and Dynamics 365 Sales streamlines operations and enhances data synchronization for improved business efficiency.
 Microsoft Dynamics Business central
Barcode in BC24 encodes data in a series of bars and spaces of varying widths. The symbology is used primarily for inventory management and other applications requiring data encoding.

the This keyword has a unique and specific role, which differs slightly from its use in other programming languages like C# or JavaScript
 Microsoft Dynamics Business central
The CodeAnalyzer in Microsoft Dynamics 365 Business Central is crucial for maintaining high code quality and consistency.
 Microsoft Dynamics Business central
Integrating Microsoft Teams with Business Central streamlines collaboration and boosts productivity by facilitating real-time communication around pertinent business data within a single platform.
 Microsoft Dynamics 365, Microsoft Dynamics Business central, Visual Studio Code
Explore how transitioning from BLOB to Media and MediaSet data types in Business Central enhances image handling and storage efficiency.
 Microsoft Dynamics 365, Microsoft Dynamics Business central, Microsoft Dynamics NAV
Print Trans Header and Trans Footer are options related to the layout and rendering of reports, particularly when dealing with transactional data.
 Microsoft Dynamics Business central
Business Central typically indicates an issue with the way the amount has been entered on the specified journal line.
 Microsoft Dynamics Business central, Microsoft Dynamics NAV
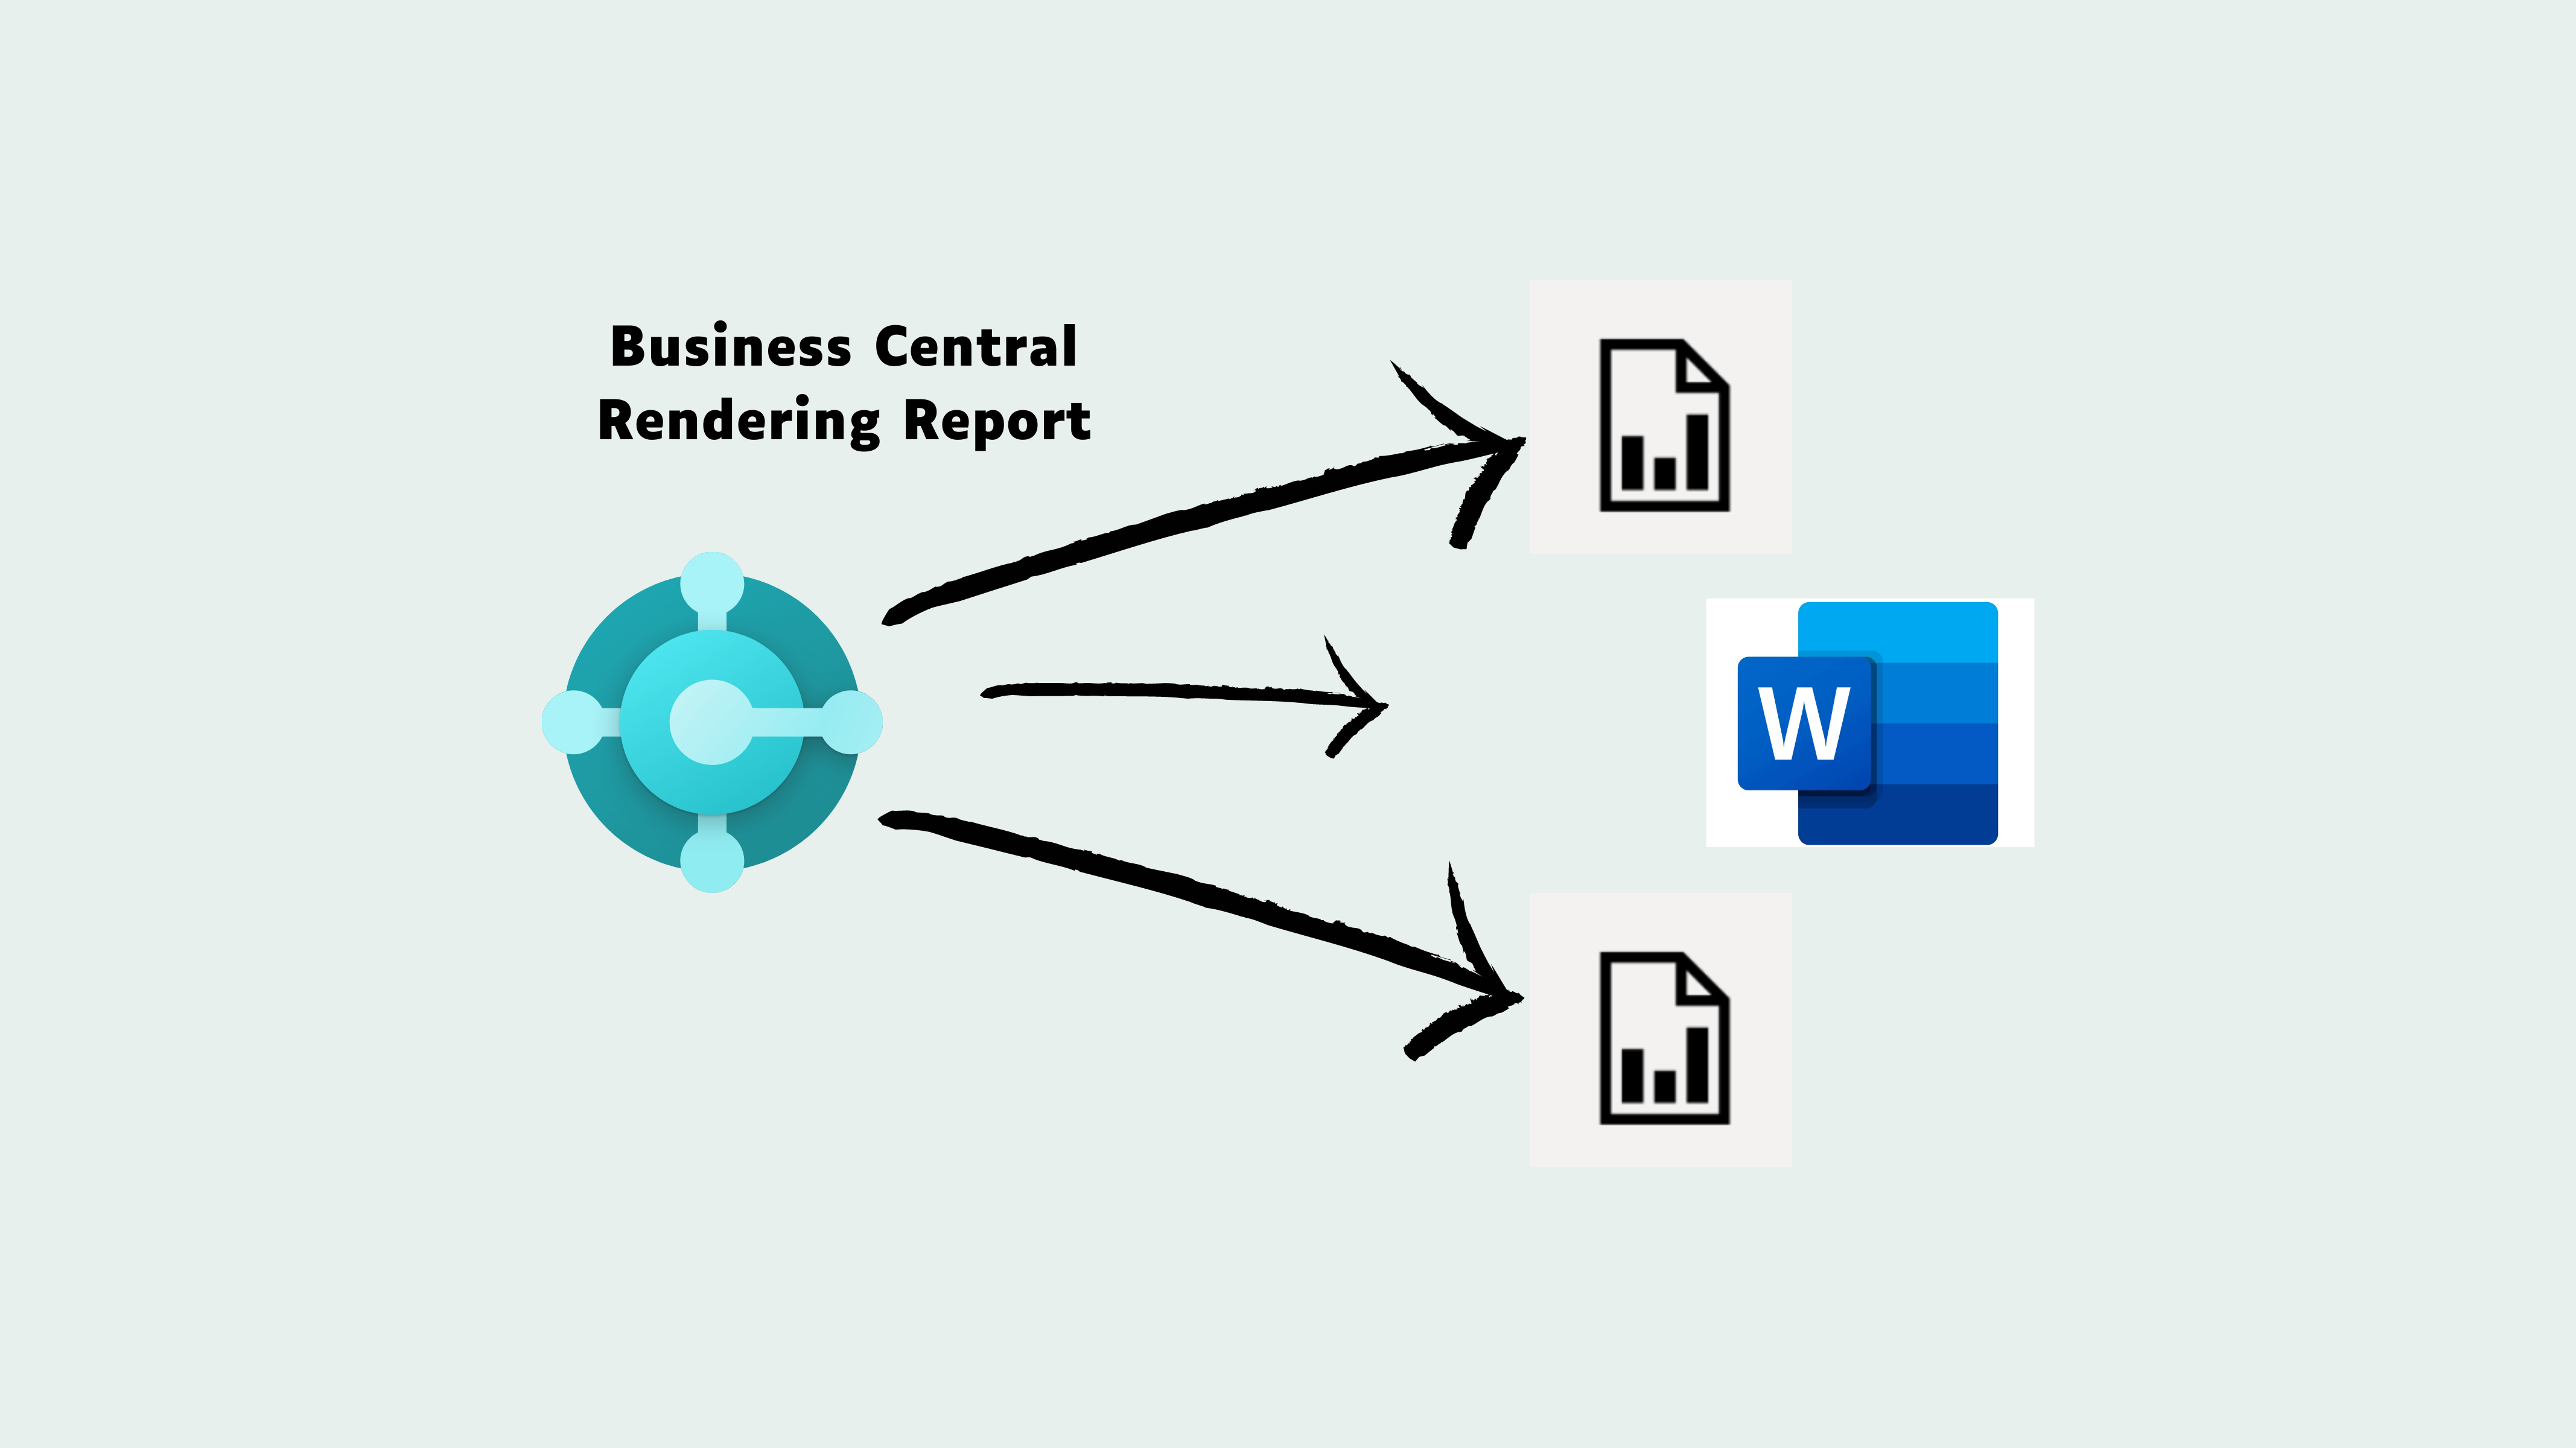
Rendering layouts involve designing and generating the visual presentation of reports and documents to meet specific business requirements and aesthetics.
 Integration, Microsoft Azure AD, Microsoft Dynamics Business central
Integrating D365 Business Central with Azure Service Bus enables seamless communication between Business Central and other systems or applications.
 Microsoft Dynamics Business central
Item reservation in ensures specific inventory is allocated to orders, preventing stockouts and guaranteeing timely fulfillment.
 CodeCop Analyzer, Microsoft Dynamics Business central, Visual Studio Code
CodeCop is an analyzer that enforces the official AL Coding Guidelines.
 Integration, Microsoft Dynamics 365, Microsoft Dynamics Business central
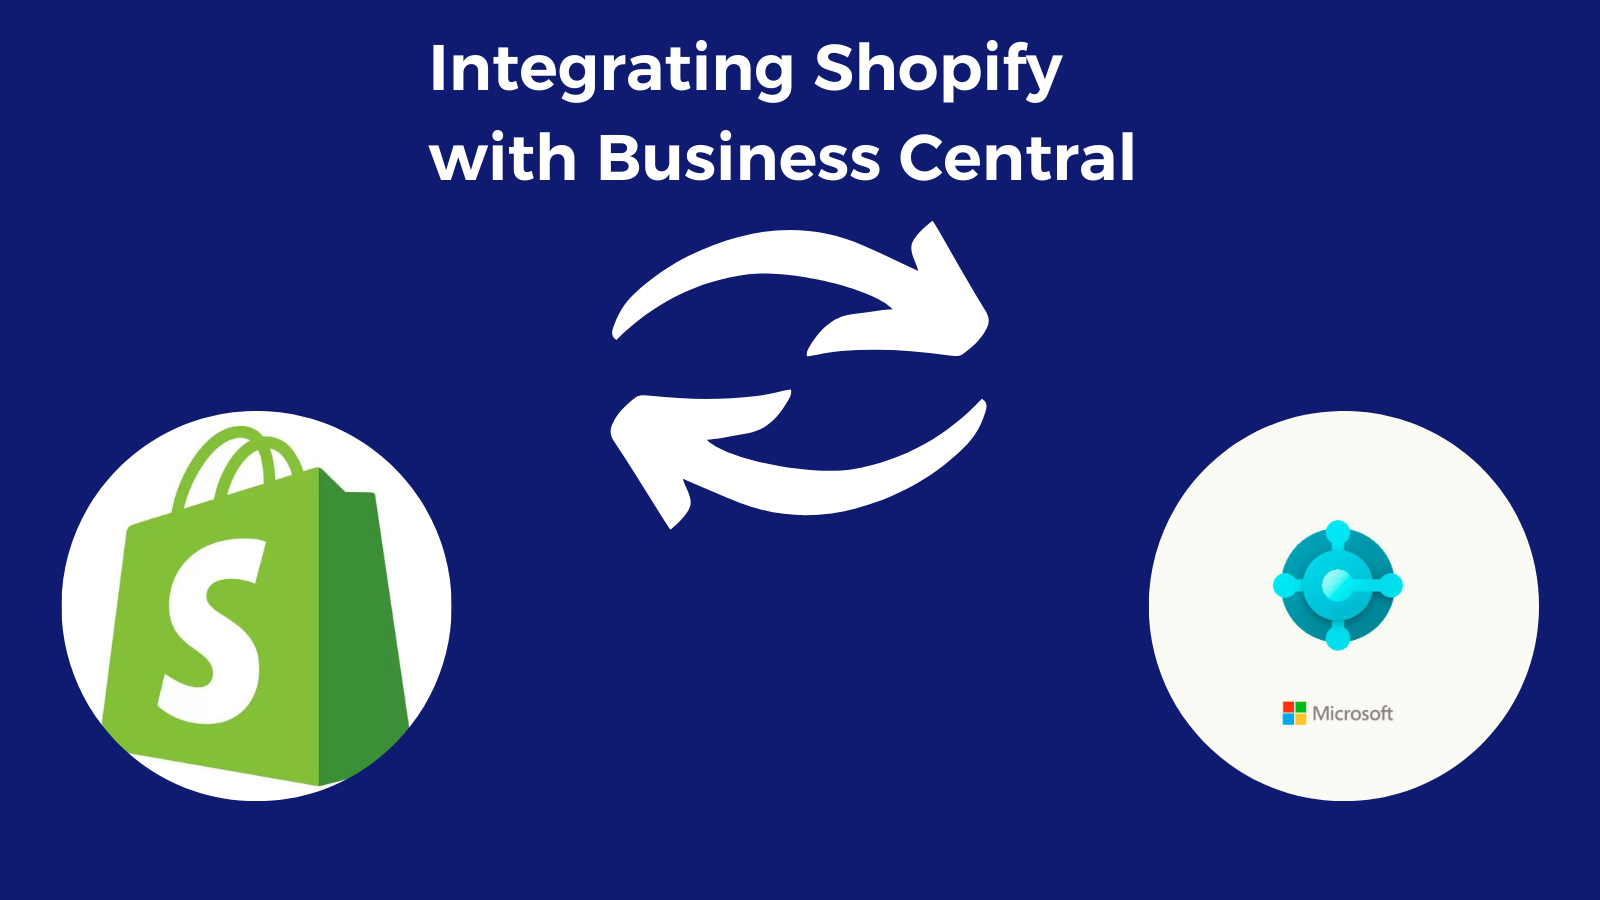
Shopify integration with Business Central synchronizes orders, products, customers, and inventory, optimizing e-commerce operations and ensuring data consistency.
 Microsoft Dynamics Business central
Business Central's Credit Limit feature sets maximum customer credit and manages limits in sales transactions to prevent overextension.
 Microsoft Dynamics Business central, Microsoft Dynamics NAV
Exporting an Excel file with multiple sheets from Microsoft Dynamics 365 Business Central involves utilizing AL code to generate and structure the file.
 Microsoft Dynamics Business central
Business Central's Report extension enables adding fields, data items, and layout changes to existing reports without altering the original report object.
 Microsoft Dynamics Business central
Attaching documents in a custom page FactBox in Business Central involves creating a custom FactBox that allows users to manage document attachments.
 Microsoft Dynamics Business central
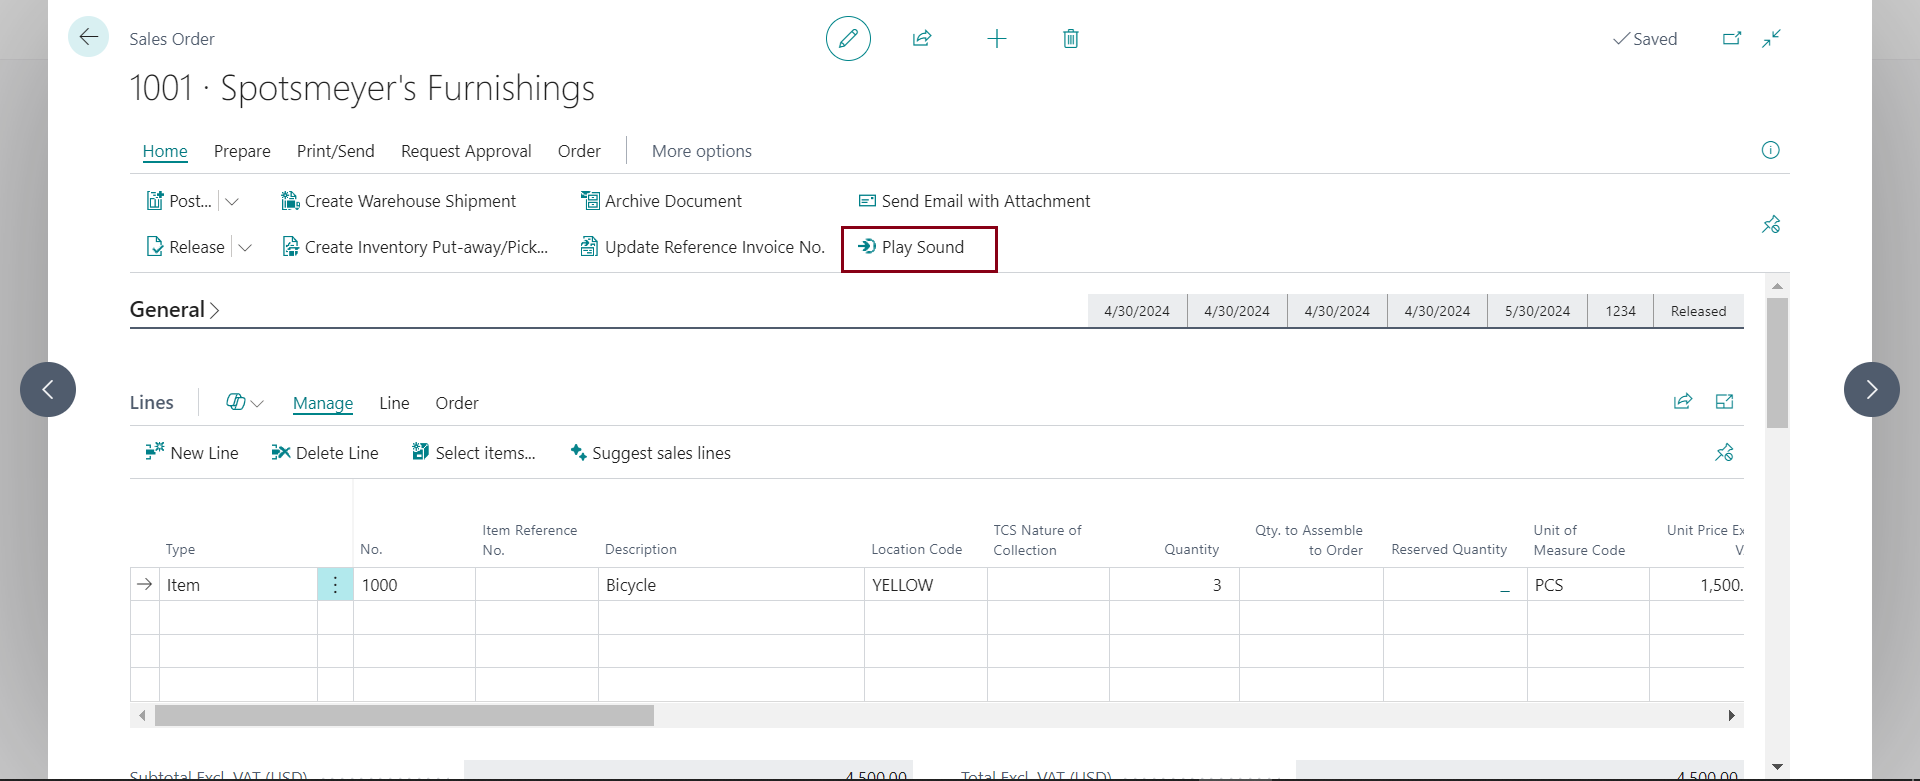
Most of us have preferences for different sound-based notifications that are helpful and significant in differentiating notifications or pop-up messages and errors.
 Microsoft Dynamics Business central
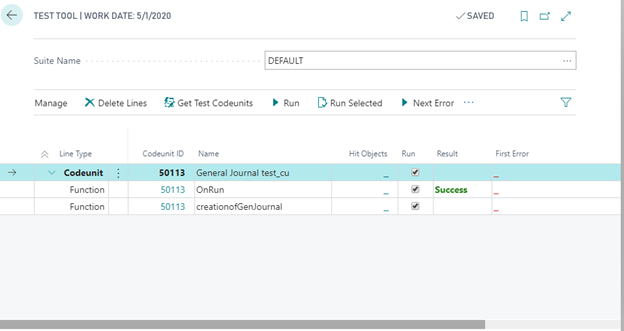
Creating and testing a Test Codeunit in AL for Dynamics 365 Business Central involves several steps. Test Codeunits are used to automate the testing of your application to ensure it functions correctly.
 Microsoft Dynamics Business central, Visual Studio Code
In Business Central, Using AL (Application Language) by writing validation code in the table or page where the field resides.
 Microsoft Dynamics Business central, Microsoft Dynamics NAV
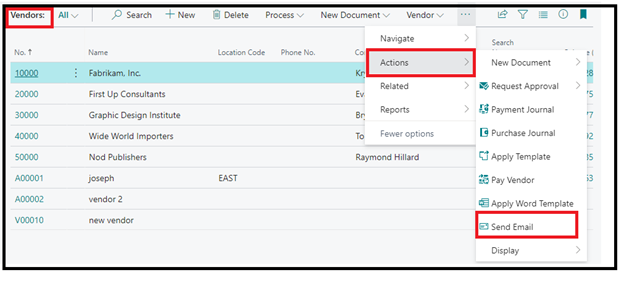
Sending emails to all suppliers and subcontractors in Dynamics 365 Business Central can be achieved through the use of the integrated email functionality.
 Microsoft Dynamics Business central, Microsoft Dynamics NAV
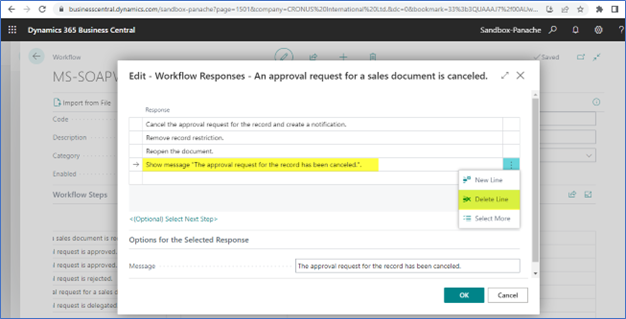
In Business Central, Managing approval requests for multiple sales orders efficiently is crucial for streamlining workflows and ensuring smooth business operations.
 Microsoft Dynamics 365, Microsoft Dynamics Business central, Microsoft Dynamics NAV
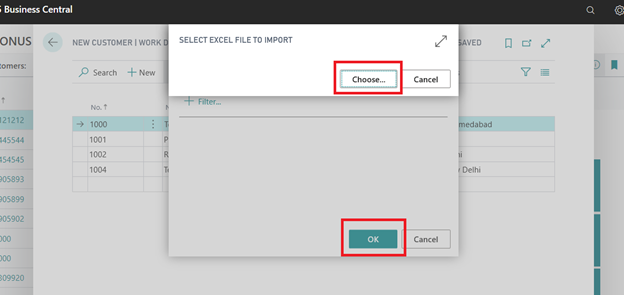
Importing data to an Excel Data Report in Business Central involves a streamlined process that allows users to seamlessly integrate external data into their business management system.
 Microsoft Dynamics Business central, Microsoft Dynamics NAV
Creation of a purchase order from a sales order is common in drop shipment scenarios or special customer orders.
 Microsoft Dynamics Business central
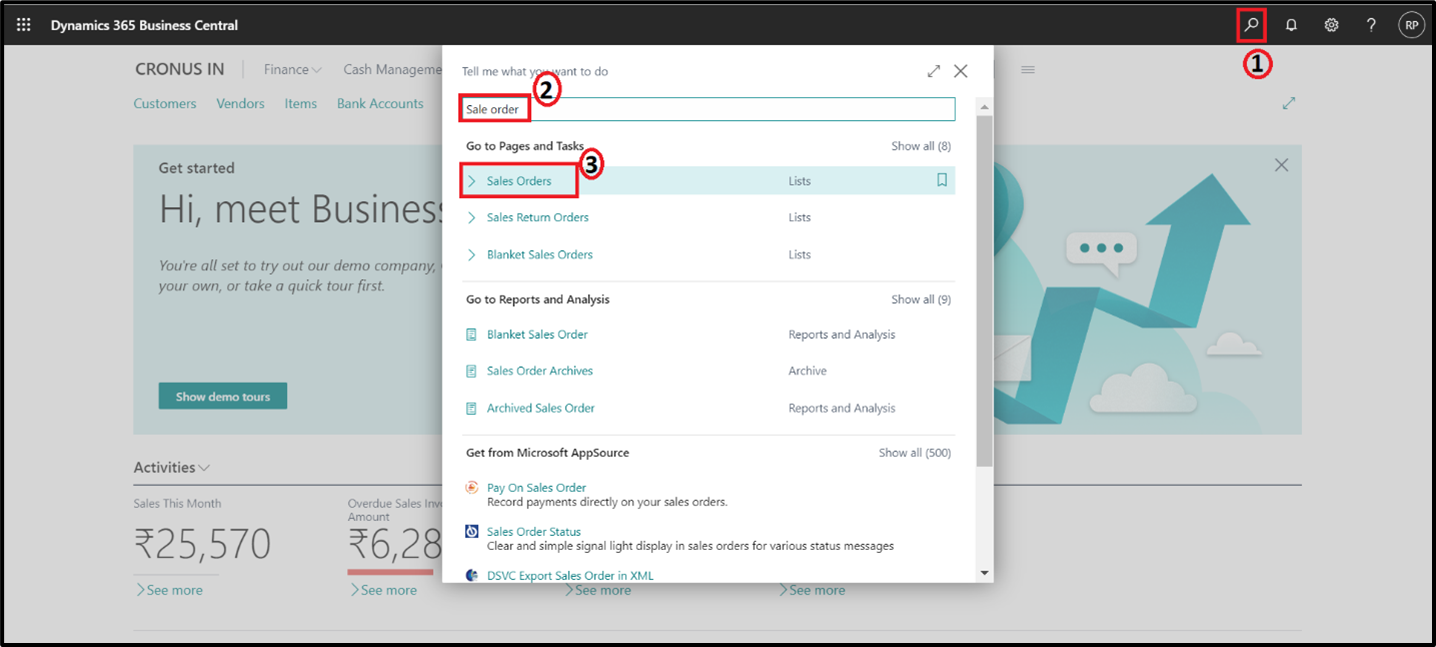
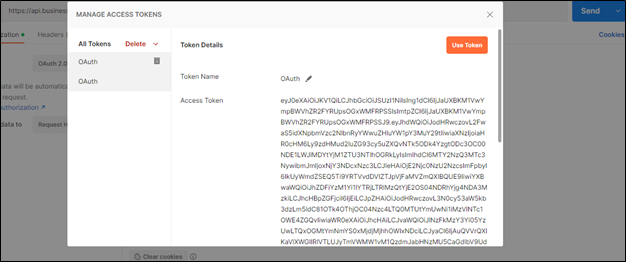
Microsoft has deprecated the capability to access web services in SaaS using Basic Authentication, emphasizing OAuth for secure integration in Business Central.
 Microsoft Dynamics Business central, Microsoft Dynamics NAV
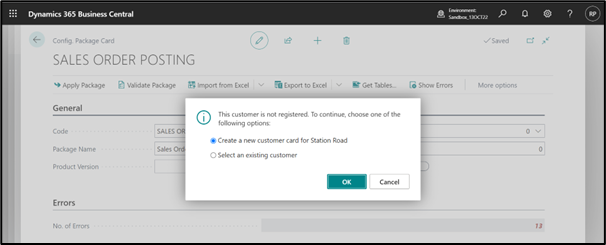
There is one feature in Business central which is called the Configuration Package. The configuration package can be used for post-sales Transactions.
 Microsoft Dynamics 365, Microsoft Dynamics Business central
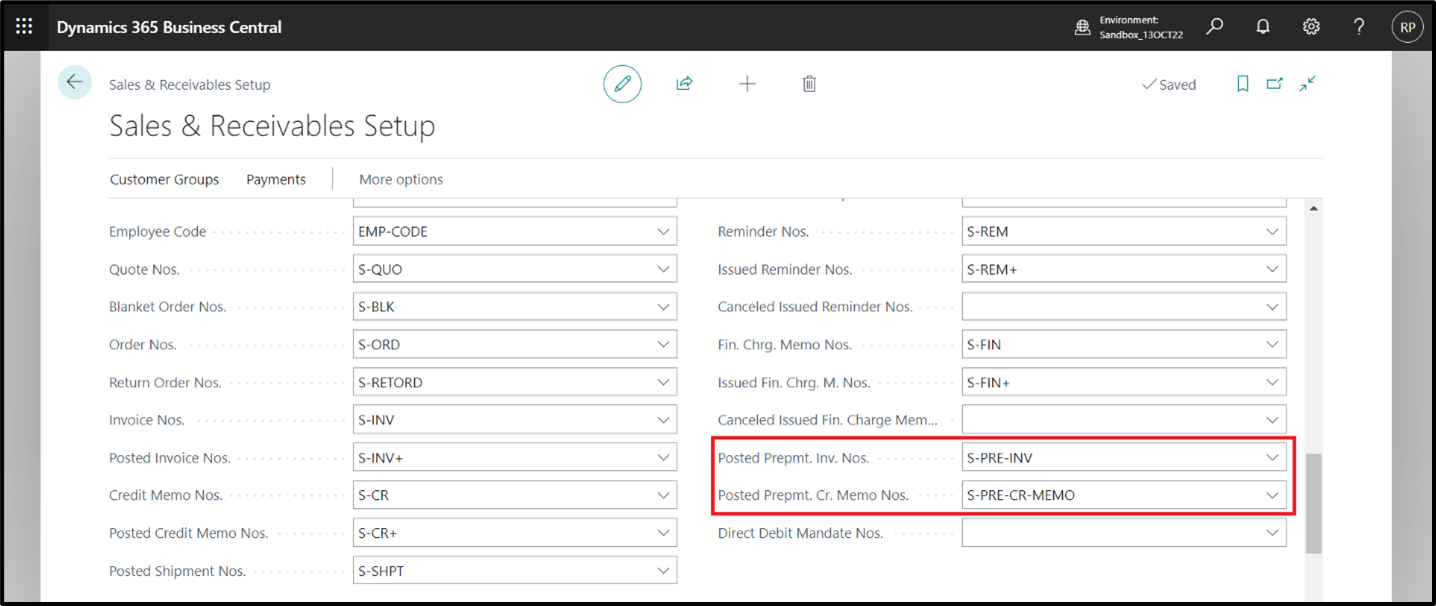
Implementing prepayment functionality in Microsoft Dynamics 365 Business Central (D365 BC) involves several steps and configurations.
 Microsoft Dynamics 365, Microsoft Dynamics Business central, Visual Studio Code
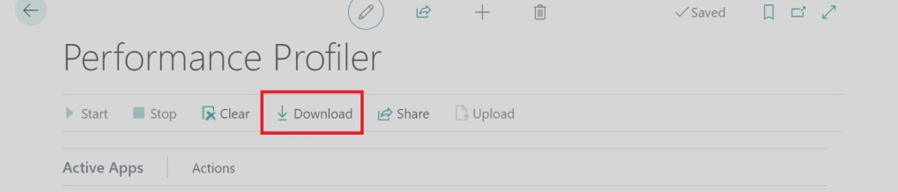
Microsoft has enhanced the AL performance profiler (available starting from version 19 only via Visual Studio Code) giving the possibility also to functional developers/consultants.
 Microsoft Dynamics 365, Microsoft Dynamics Business central, Microsoft Dynamics NAV
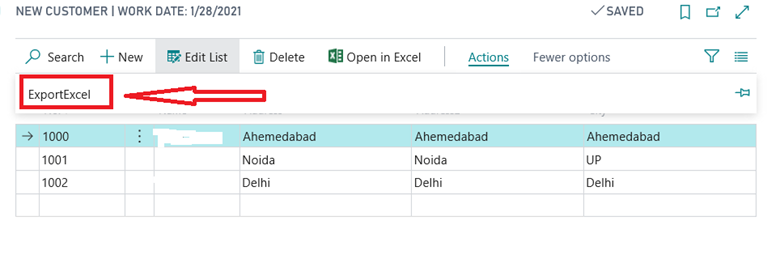
Exporting data to Excel in Dynamics 365 BC involves creating a custom AL report with the desired data and configuring it for Excel export.
 Microsoft Dynamics 365, Microsoft Dynamics Business central, Microsoft Dynamics NAV
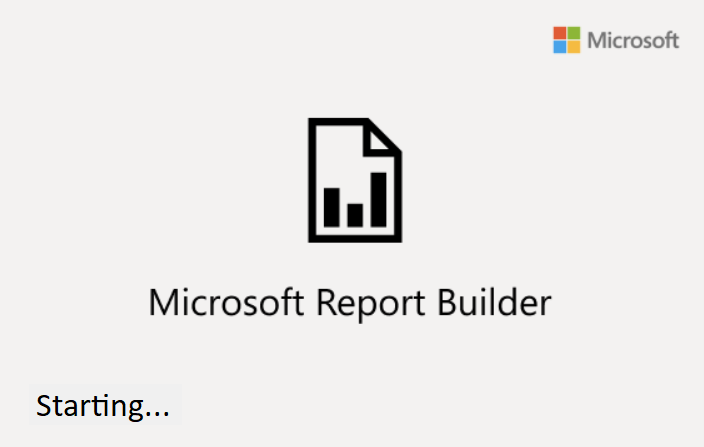
Microsoft Report Builder is a tool for crafting paginated reports, perfect for creating detailed and printable reports with diverse data sources, layouts, and visualizations
 Microsoft Azure AD, Microsoft Dynamics Business central
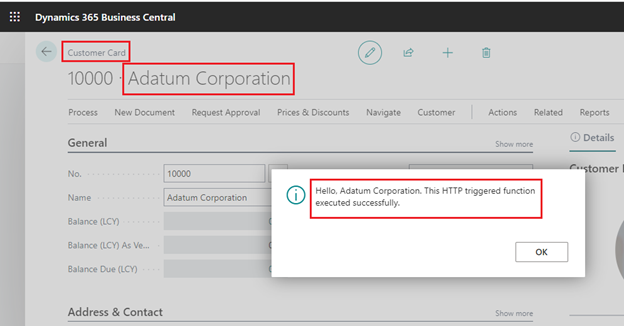
Integrating Azure Functions with Microsoft Dynamics 365 Business Central can extend the functionality of Business Central by leveraging serverless computing power.
 Microsoft Dynamics Business central, Microsoft Dynamics NAV, Power Platform
Integrating Dataverse with Business Central involves connecting two powerful Microsoft services to enable seamless data flow and interaction between them.
 Microsoft Dynamics Business central, Microsoft Dynamics NAV
Streamlines relationship management, tracks interactions, and syncs contact information with customers and vendors.
 Microsoft Dynamics Business central, Microsoft Dynamics NAV, Power Platform
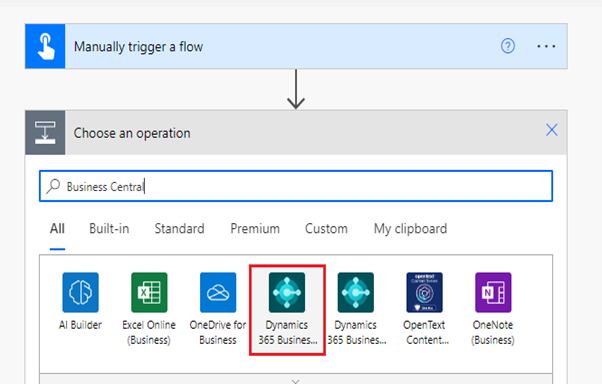
Businesses can automate the conversion of sales quotes to sales orders in Microsoft Dynamics 365 Business Central using Power Automate.
 Microsoft Azure AD, Microsoft Dynamics Business central
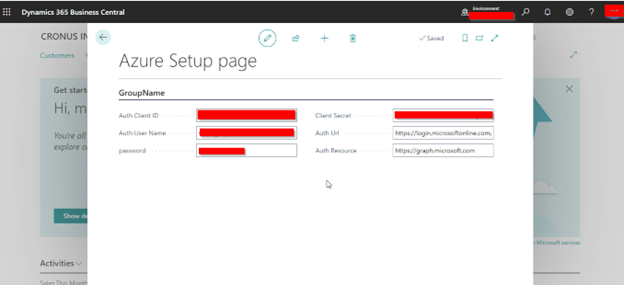
Retrieving Azure Active Directory user information within Dynamics 365 Business Central using AL can be done by leveraging the Azure AD Graph API or Microsoft Graph API.
 Microsoft Dynamics Business central, Microsoft Dynamics NAV
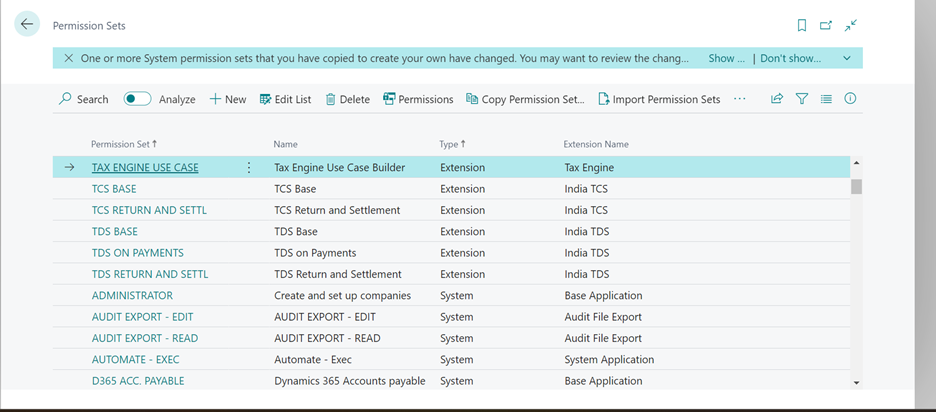
Recording permission sets in Microsoft Dynamics 365 Business Central involves creating and customizing permission sets to define what users can do within the system.
 Microsoft Dynamics Business central, Microsoft Dynamics NAV
The error message "The server has rejected the client Credentials" in Business Central typically indicates an authentication issue between the client application and the Business Central server.
 Microsoft Dynamics Business central, Visual Studio Code
In Business Central using AL code, you can create a page to display data from a temporary table, which is ideal for dynamic queries and temporary datasets.
 Microsoft Dynamics Business central, Microsoft Dynamics NAV
Using SetAutoCalcFields in Business Central offers significant benefits over CalcFields, providing automatic calculation, performance optimization, cleaner code, consistency, and convenience in bulk operations.
 Microsoft Dynamics Business central, Microsoft Dynamics NAV
Optimize AL extensions by leveraging TextBuilder over Text for enhanced string manipulation efficiency in D365 BC, boosting performance and resource utilization.
 Microsoft Dynamics Business central
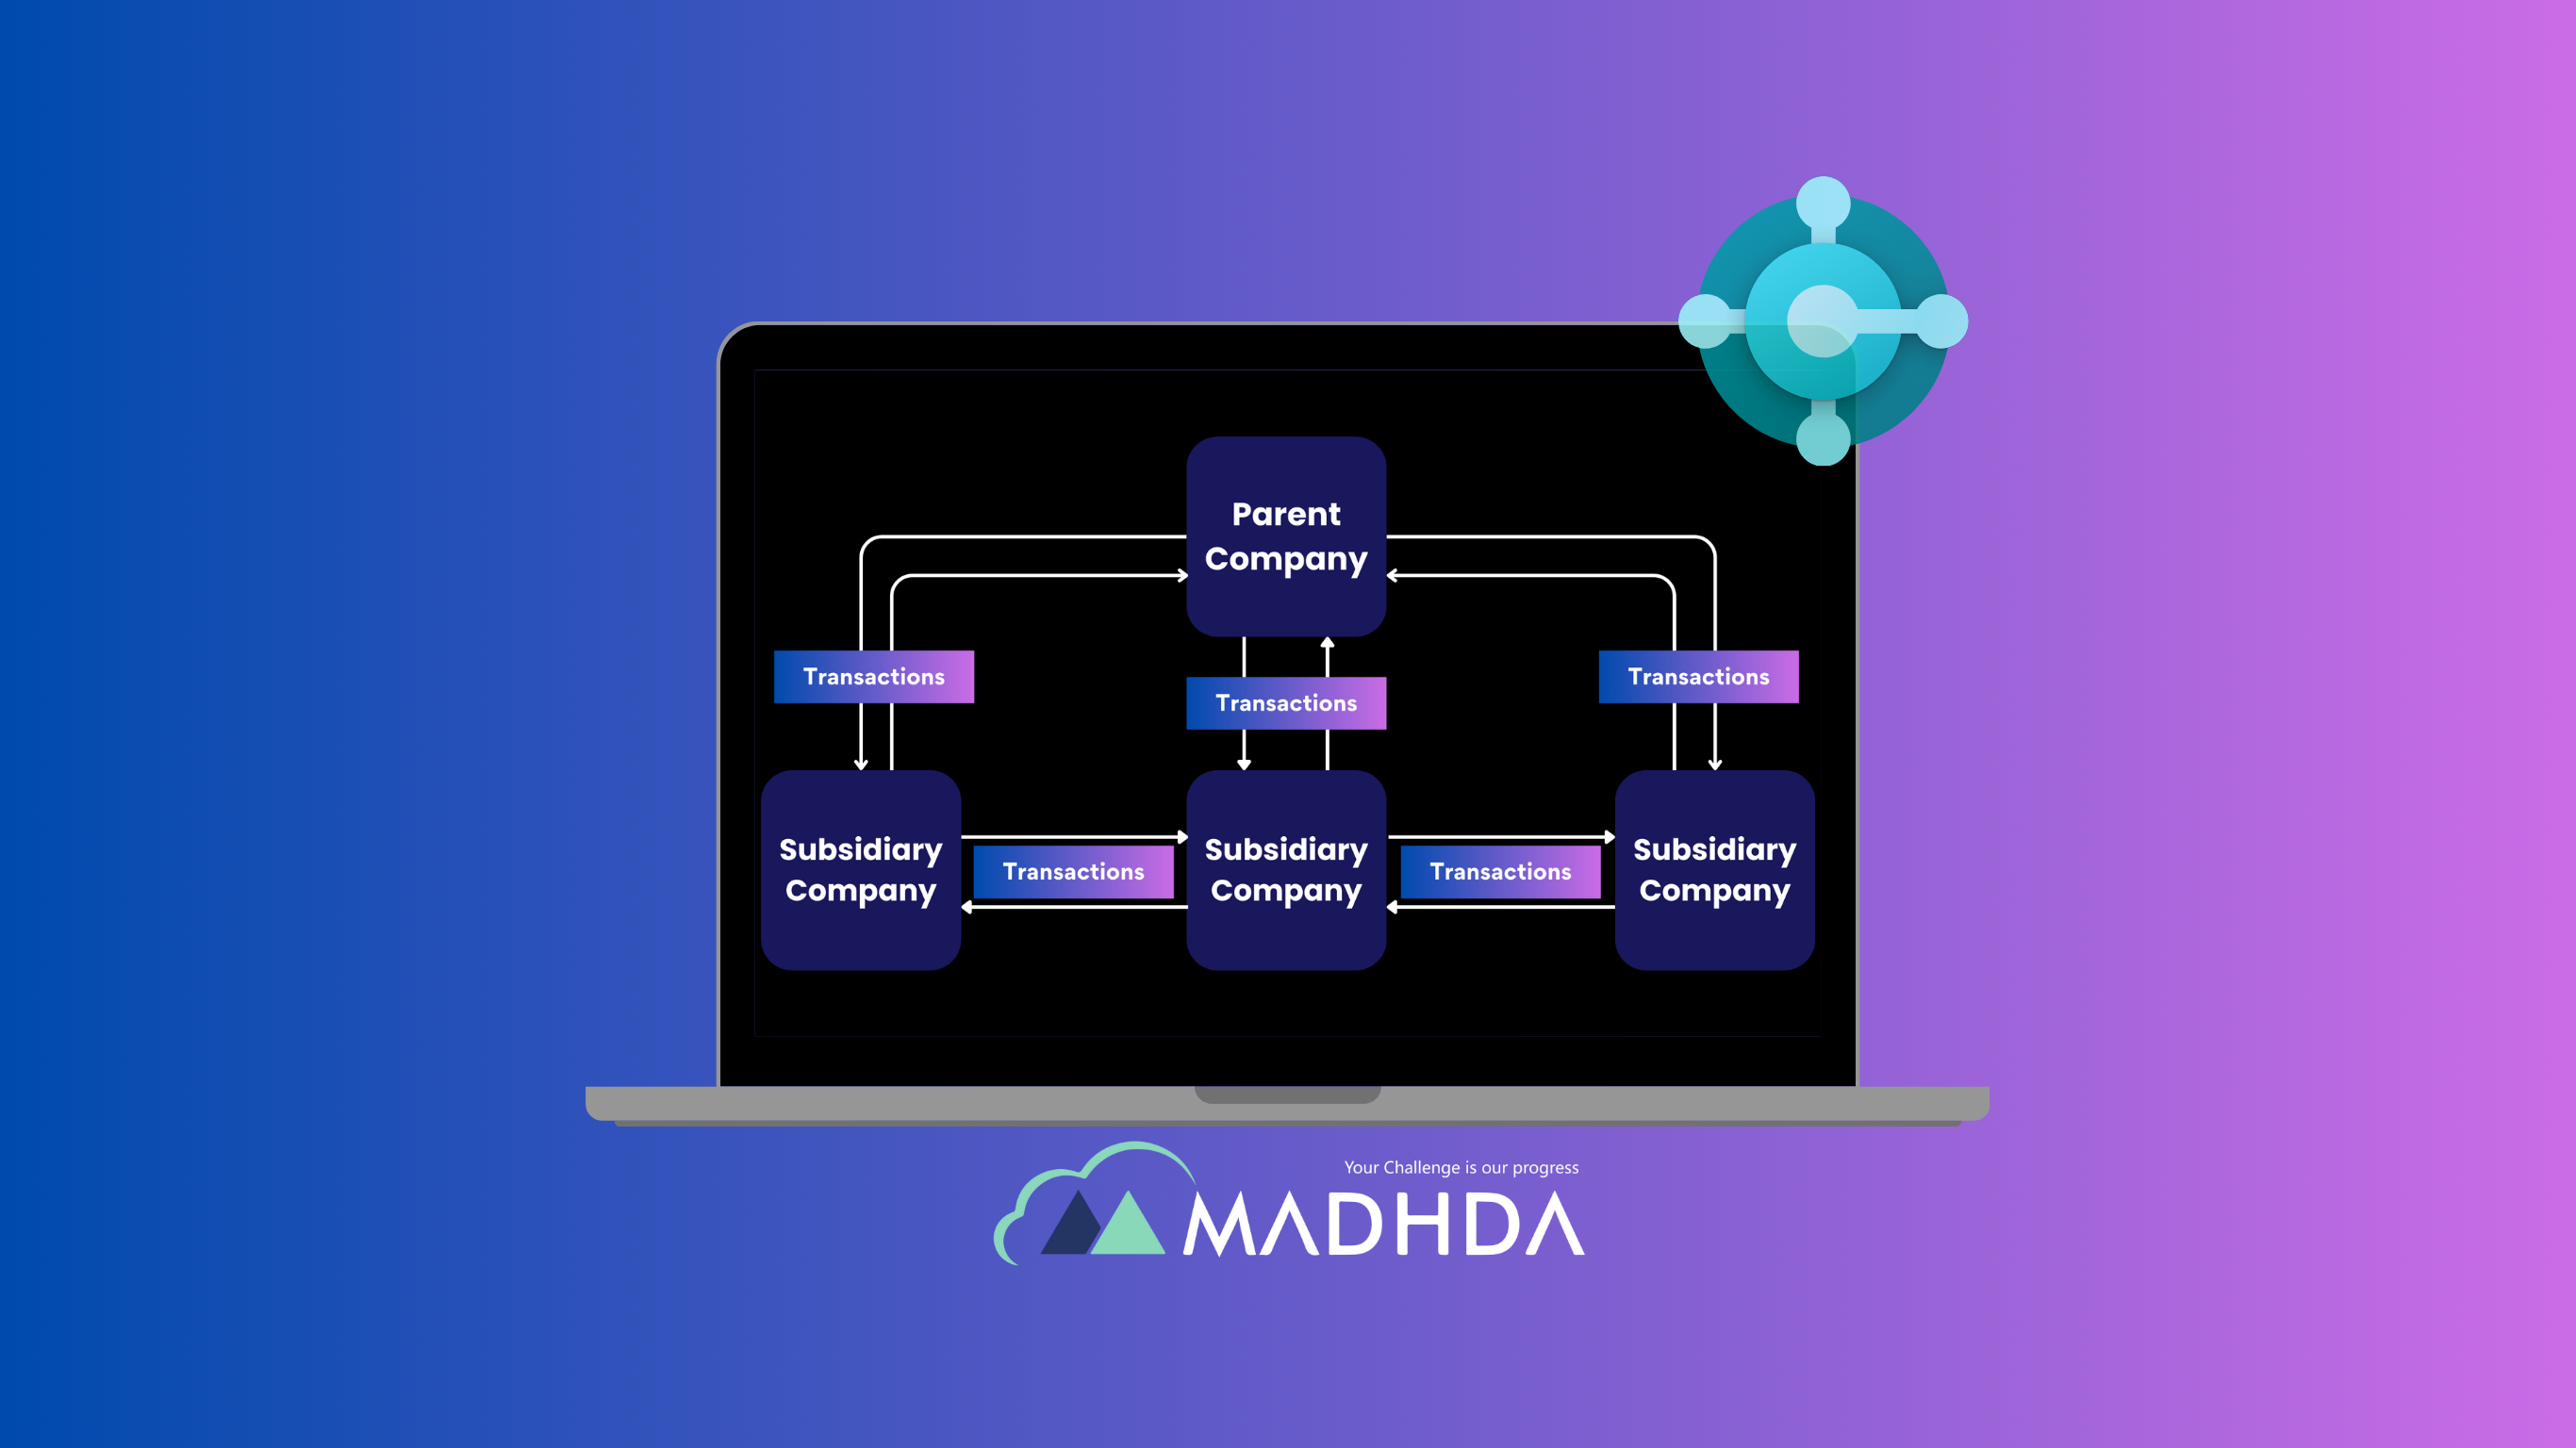
Intercompany partnerships make it easier to handle accounting processes when two or more subsidiaries of a company frequently do business with each other.
 Microsoft Dynamics Business central
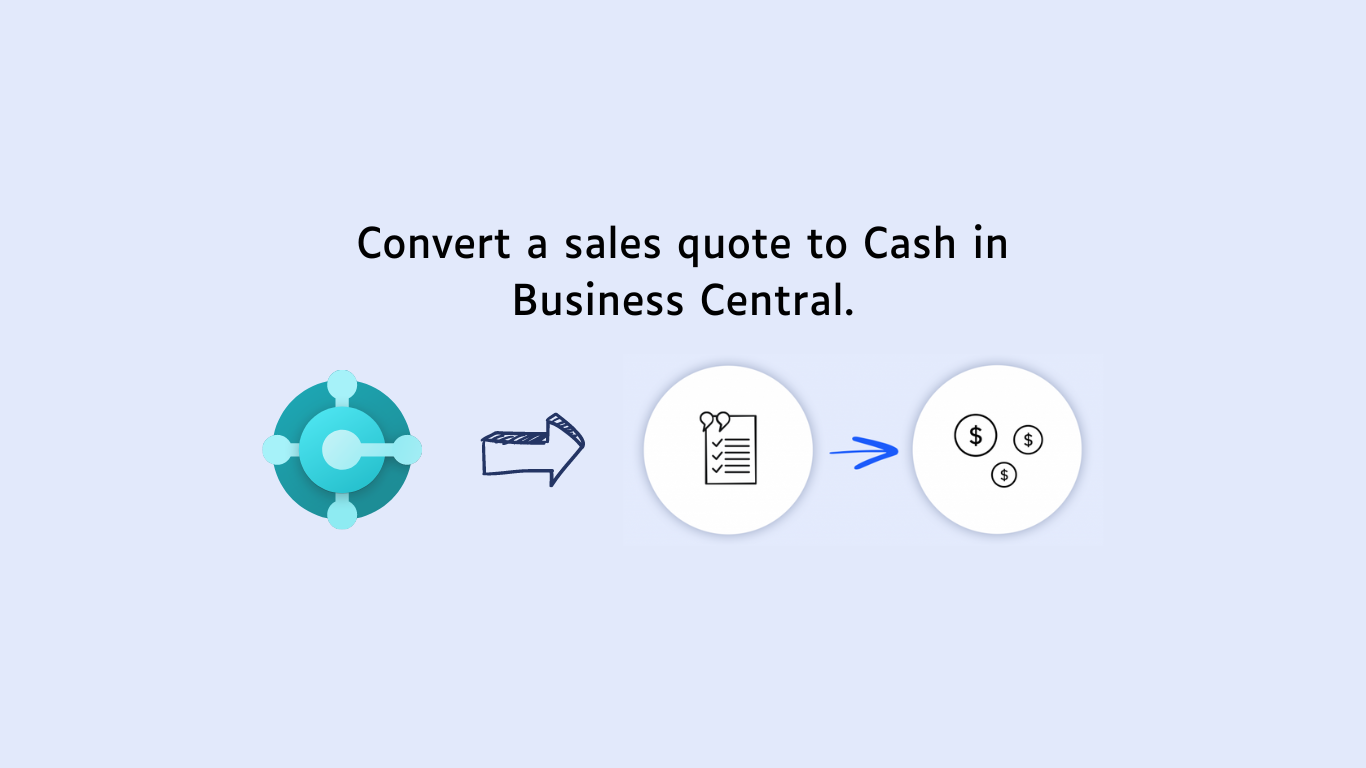
The "Quote to Cash" process in Microsoft Dynamics 365 Business Central covers the sales cycle from quote generation to cash collection.
 Microsoft Dynamics Business central
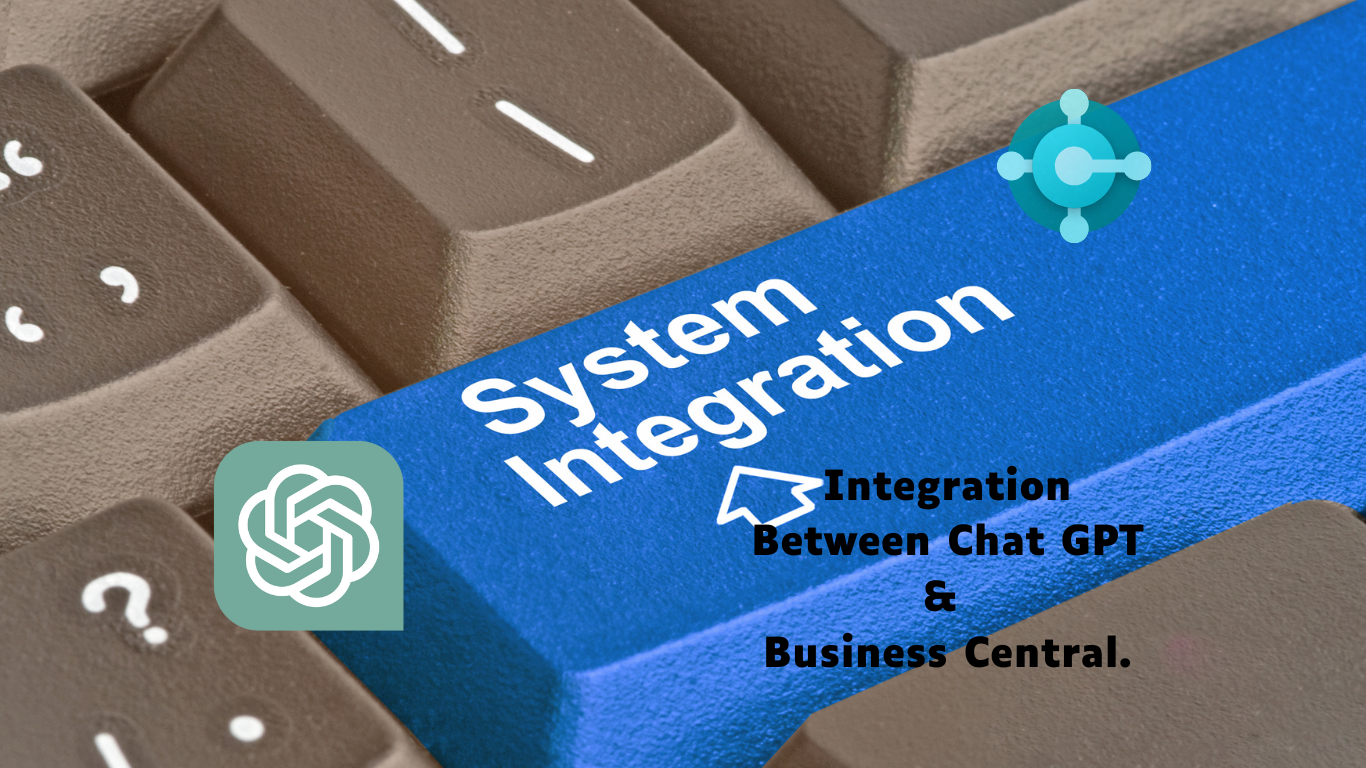
Integrating ChatGPT with Microsoft Dynamics 365 Business Central boosts customer support, data accessibility, and business process efficiency.
 Copilot
Communication and collaboration redefined by Copilot in MS teams.
 Microsoft Dynamics Business central
Creating a QR code in Business Central can be done by using AL code to integrate QR code generation libraries or by utilizing third-party services.
 Microsoft Dynamics Business central
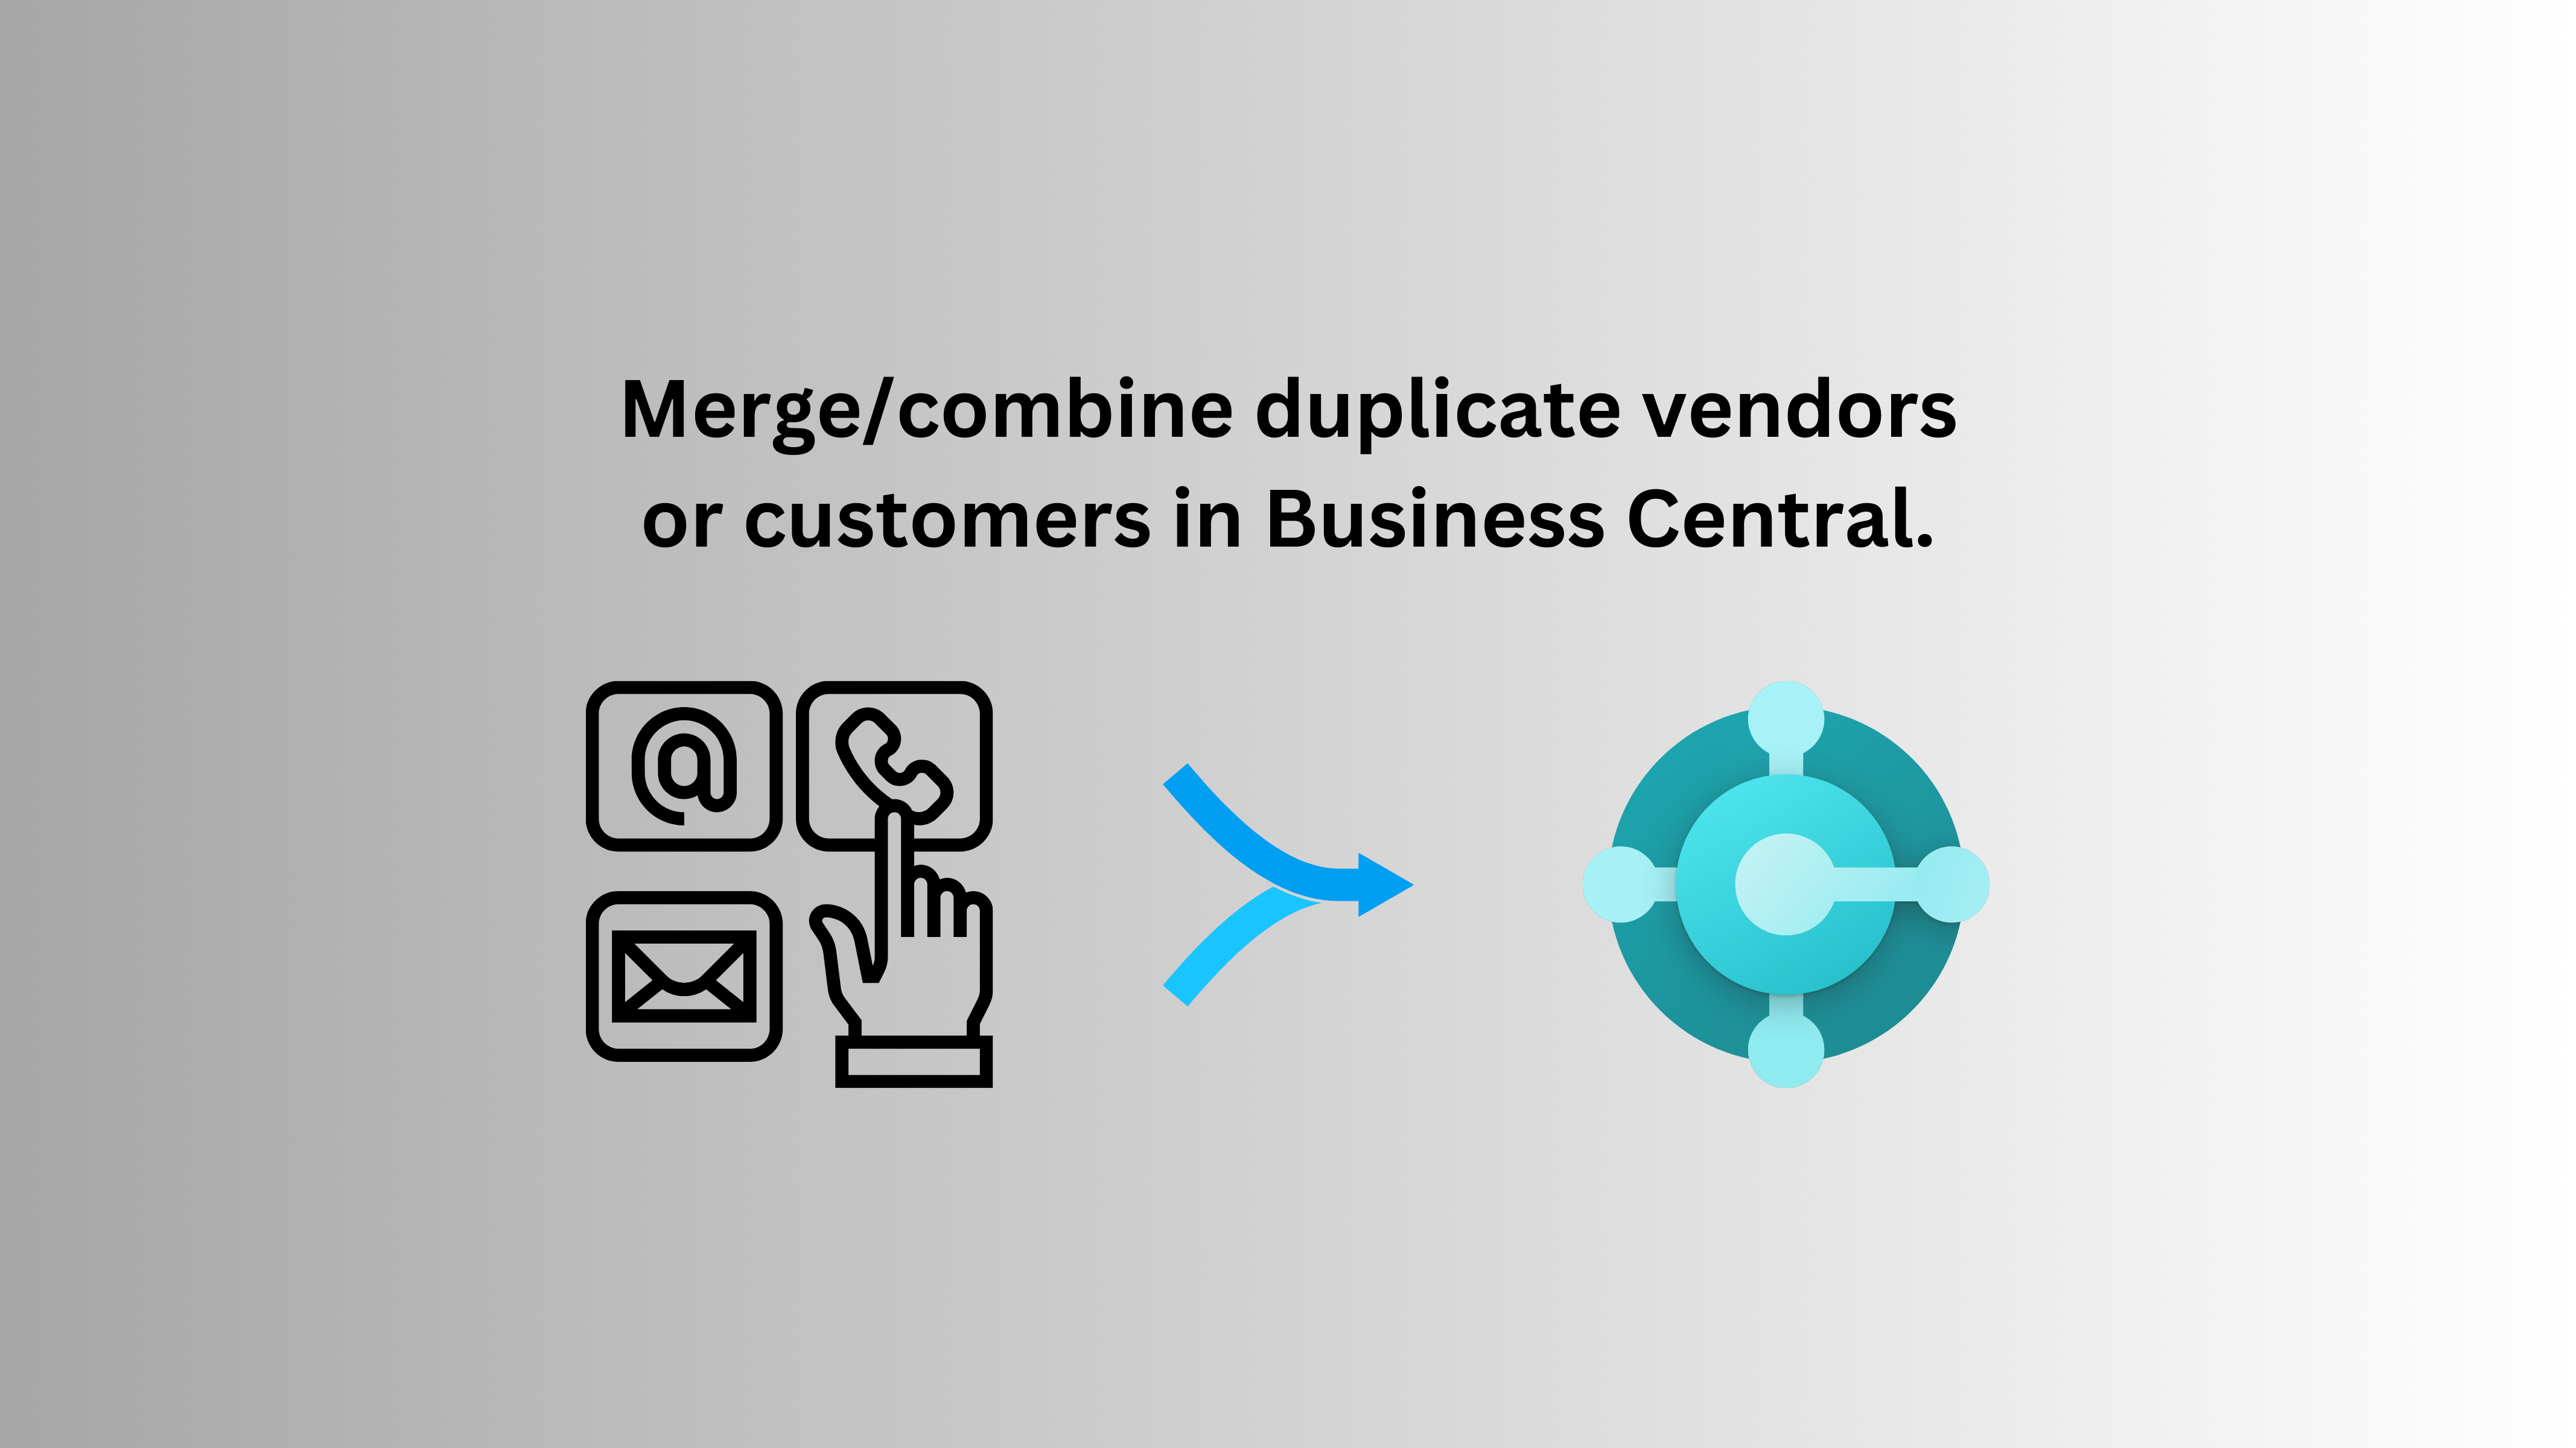
Merge customers or suppliers in Microsoft Dynamics Business Central, including historical transactions, using data migration for seamless consolidation.
 Microsoft Dynamics Business central, Microsoft Dynamics NAV
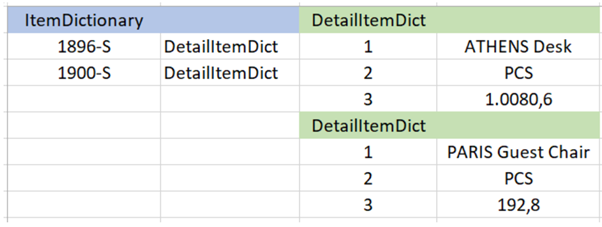
A Dictionary in programming is like a two-field table, with one field for keys and the other for values.
 Microsoft Dynamics Business central
Configure Business Central Container in Docker This document contains the process for the installation & configuration of Docker Business Central container.
 Integration, Microsoft Dynamics Business central
API for E-VAT INTEGRATION DOCUMENTATION VCIS/VSDC E-VAT integration for GRA in Dynamics 365 Business Central.
 Microsoft Dynamics 365, Microsoft Dynamics Business central, Microsoft Dynamics NAV
To handle division by zero in RDLC reports in Business Central and multiply the result by 100, you can use custom code within the report.